Closed vs. Open-Source LLMs: Current State, Capability Gap, and How to Choose
A2Agent Team · 2026-09-18T00:00:00Z
This post compares closed and open-source large language models using two benchmarks, Arena and Vals Index, as a common yardstick. Each section moves from definition to explanation to evidence to conclusion, and together they answer three questions: how should a model's capability be measured, how large is the gap between closed and open models, and how should different users choose between them?
Data: Arena and Vals Index, as of September 2026.
1. How to measure a model's capability
Generative AI has split the model market into two camps. OpenAI, Anthropic and Google lead the closed camp; Alibaba (Qwen), Zhipu (GLM), Moonshot AI (Kimi) and DeepSeek lead the open one. Before asking whether open models have caught up, we need to settle how capability should be measured in the first place. Without a shared yardstick, claims that one side has "caught up" or "fallen behind" have nothing to stand on, and any comparison or buying decision built on them falls apart too.
Two families of benchmarks dominate. The first is the Arena leaderboards, which rely on human preference evaluation. The same task goes to several models at once, users vote blind without knowing which model wrote which answer, and an Elo system turns the votes into scores. An Arena score tells you how often users prefer a model over its opponents. It doesn't directly tell you whether the answer was correct.
Vals Index looks at how models perform in real work: financial analysis, legal reasoning, software development and autonomous agent tasks. Its score is roughly the average completion or success rate across a large set of such tasks. Put simply, Arena measures which model users like, and Vals measures which model gets the work done.
| Benchmark | Method | What it tells you |
|---|---|---|
| Arena | Blind human preference votes, scored with Elo | A quick read on how general users feel about a model, though it can't separate answers that look good from answers that are right |
| Vals Index | Average completion rate on real tasks | Built on finance, legal, coding and agent tasks, so it's closer to the delivery capability enterprise buyers care about |
Because the two systems work differently, they measure different things. You can't convert a score on one into a score on the other, and a result on one leaderboard can't be used to overturn a result on the other.
So the first step in comparing closed and open models is choosing the yardstick, before looking at any scores. For user preference, look at Arena. For task completion, look at Vals. A comparison only means something inside one of them.
2. How big the gap really is
With the yardstick fixed, closed and open models can be compared on three dimensions.
Complex reasoning is the ability to carry out multi-step analysis, long-horizon planning and cross-domain synthesis. Think financial due diligence, legal case analysis, corporate strategy research or a long business report, where a model has to stay stable across dozens or even hundreds of reasoning steps. Agent execution is the ability to go beyond answering questions: calling tools, search and code interpreters, and running a workflow through several steps on its own. Arena's WebDev leaderboard lists multi-step reasoning and tool use among its core tests. English professional performance is whether a model's output in investment banking reports, academic papers, consulting decks and legal documents matches the style and logic Western professional firms expect.
Closed models lead on all three, for two structural reasons. OpenAI and Anthropic entered the field first and have been through the longest cycles of user feedback, and their stability on complex tasks comes from that long refinement. The other reason is training data. The leading closed models were trained mainly on the English-language internet, and most high-value professional material in banking, consulting, academia and law exists in English. That's why closed models usually fit Western firms' expectations better on English professional work, and why many international companies still pick OpenAI and Anthropic first.
The gap isn't huge, though. Leading open models have improved quickly in recent years, for reasons that are just as clear. Qwen, DeepSeek, GLM and others are released fairly openly, so research groups and companies can build on them and iterate fast, which spreads training and adaptation costs across the industry. They also have an edge with Chinese data: for Chinese policy analysis, business context, market research and writing, the top open models sit closer to the local context. And their developers optimize for cost. Closed vendors chase the strongest possible performance, while the open camp aims for the lowest cost at acceptable performance, something like 95% of the capability at 10% of the price. Both strategies make sense, and together they shape today's market.
On Arena's Image-to-WebDev leaderboard, GPT-6 Astra ranks first in the world with 1733 points and Claude Fable 5.1 is second with 1710. Both also sit at the top of Vals Index, so the closed models' lead holds on real tasks in finance, law, coding and agent workflows, as well as on user preference. On the open side, Qwen 3.8 Max scores 1639, GLM-5.3 Flash 1588 and Kimi K3 Max 1579, which puts the leading open models in the global top tier. Against GPT-6 Astra's 1733, Qwen reaches about 94.6%, GLM about 91.6% and Kimi about 91.1%.
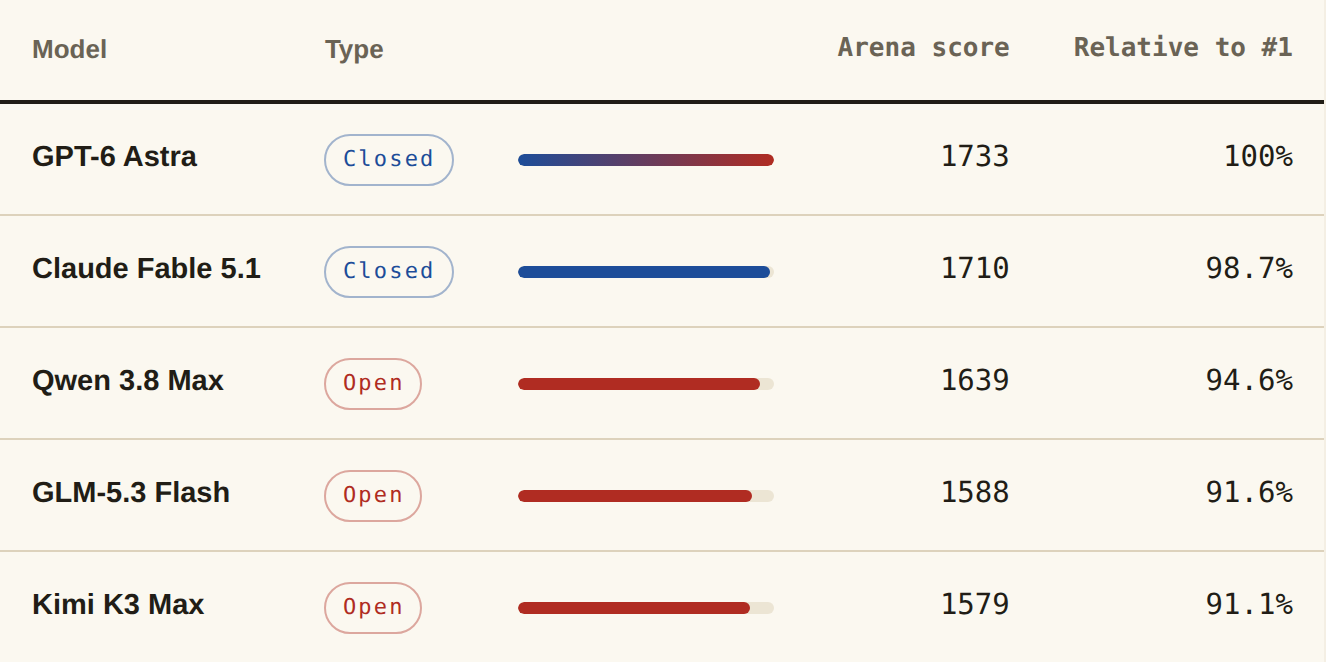
Table 1. Arena Image-to-WebDev leaderboard (2026)
Note: Scores are from Arena's Code Arena: Image-to-WebDev Leaderboard (2026). "Relative to #1" uses GPT-6 Astra's score as the baseline.
In raw points, Qwen 3.8 Max trails GPT-6 Astra by 94 (about 5.4%) and GLM-5.3 Flash trails by 145 (about 8.4%). Those gaps come from Arena's user-preference view. Ask instead which model actually finishes the work, and the Vals Index homepage leaderboard gives a different reading: there, the leading open models trail the top model by 16% to 25% in real task completion.
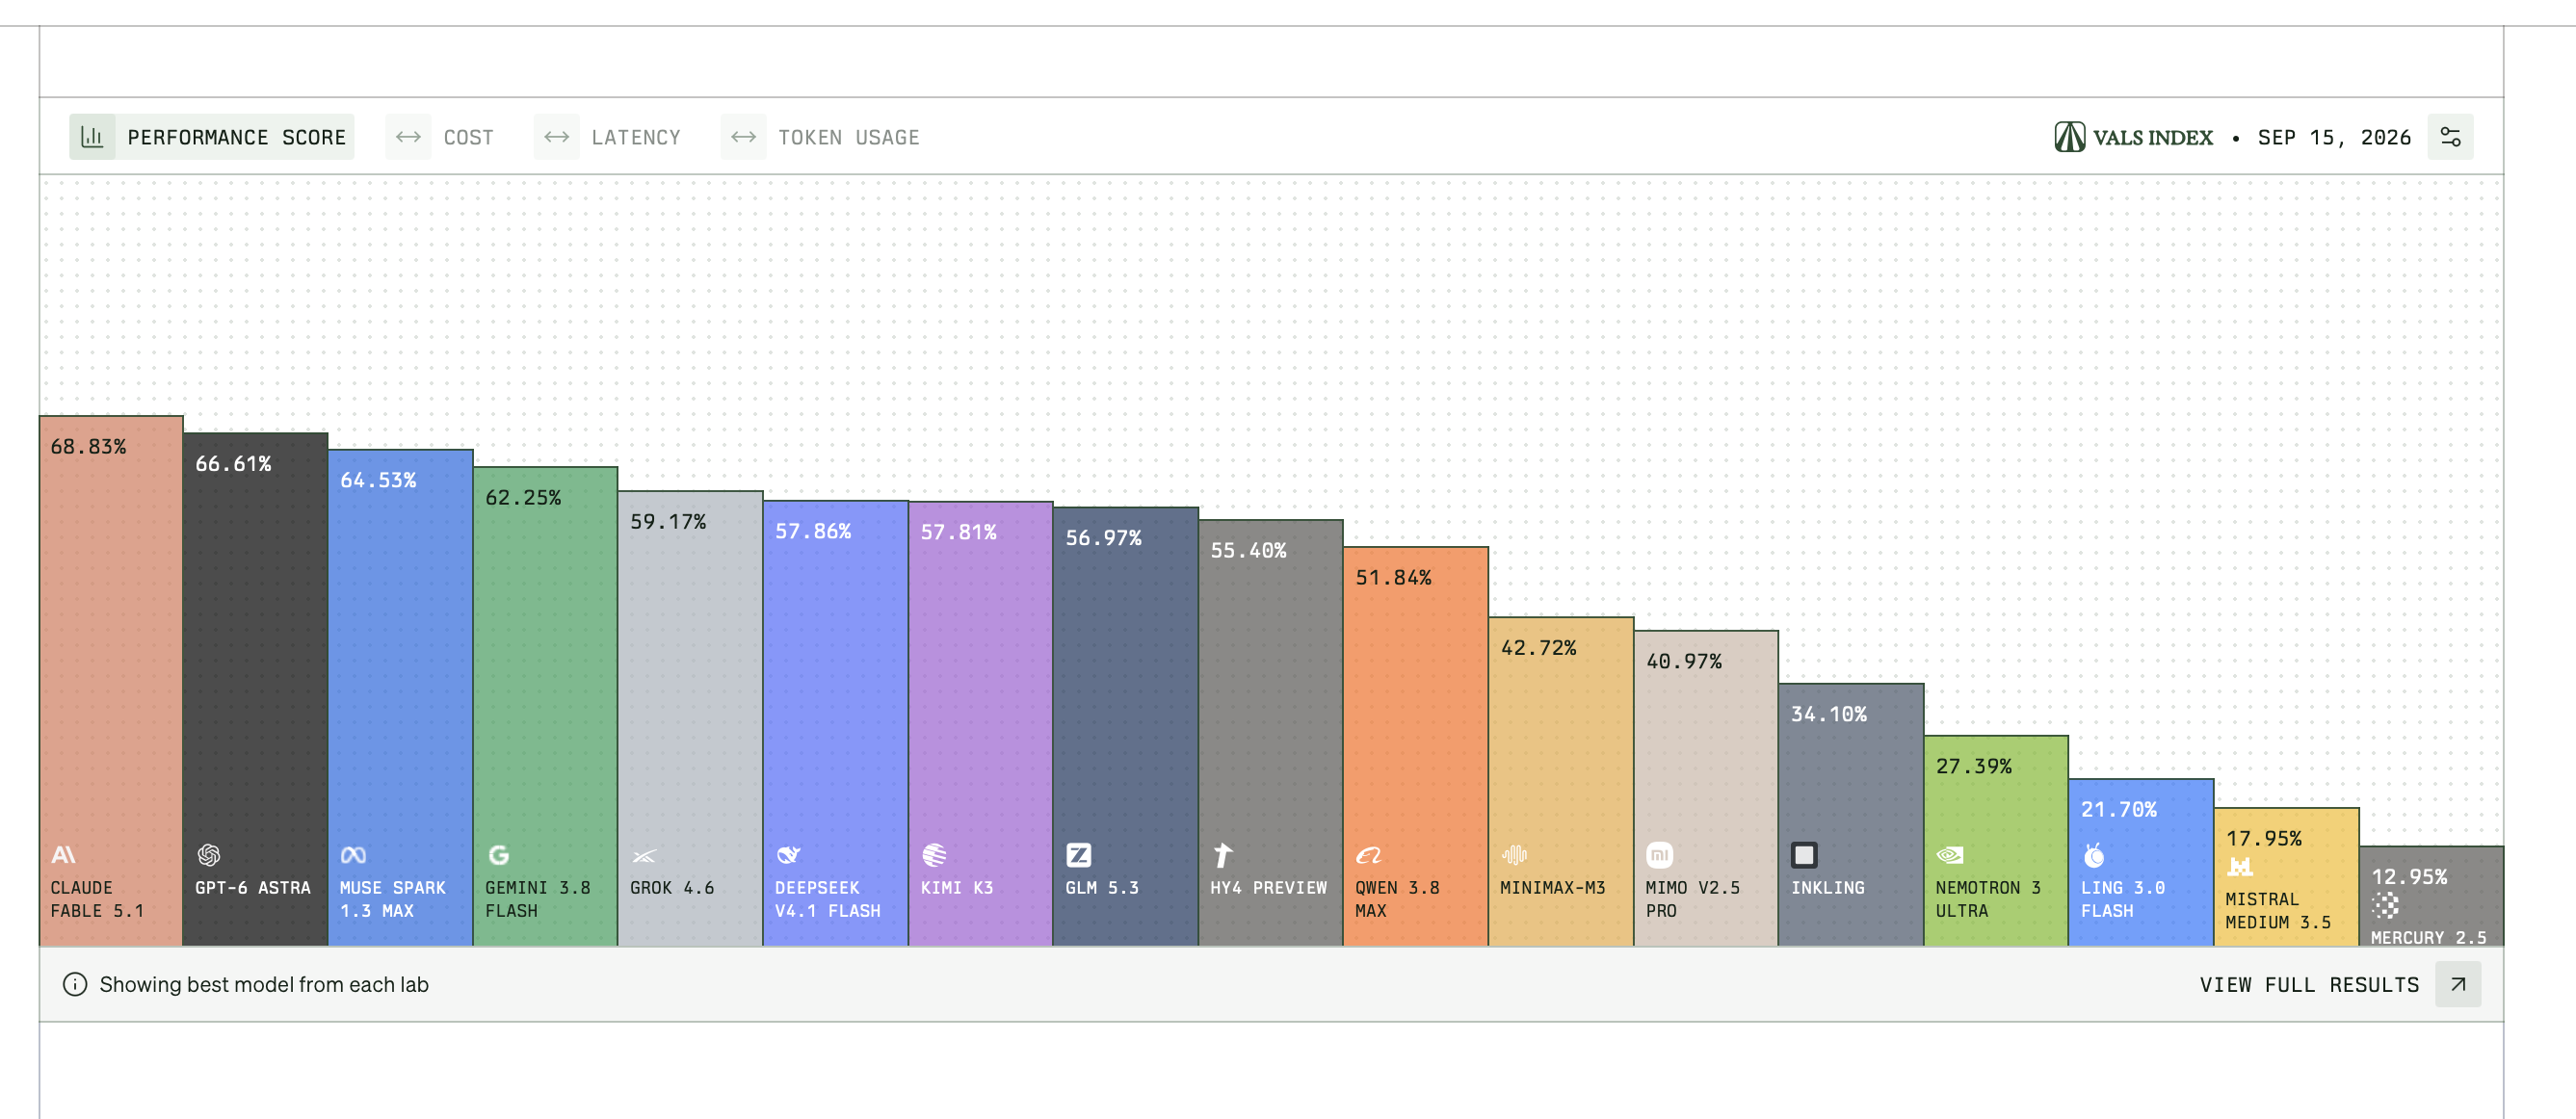
Figure 1. Vals Index leaderboard from the Vals homepage (vals.ai/home), captured September 18, 2026. It shows the overall Vals Index ranking with the best model from each lab; data updated September 15, 2026.
The Vals homepage headline, Testing AI on Real-World Tasks, describes what the site does. Its subheading adds that it evaluates tasks with economic value, such as finance and software, along with frontier-risk tasks such as cybersecurity and recursive self-improvement. Vals defines the Index as a single measure of AI's potential economic impact: agent performance on finance, coding and legal tasks, weighted by each industry's share of GDP. Claude Fable 5.1's top score of 68.83 means it completes roughly 68.83% of these tasks. Because the chart shows one model per lab, Claude Fable 5.1 leads at 68.83% and GPT-6 Astra follows at 66.61%. Claude Opus 5 (67.21%), also from Anthropic, appears in the full leaderboard.
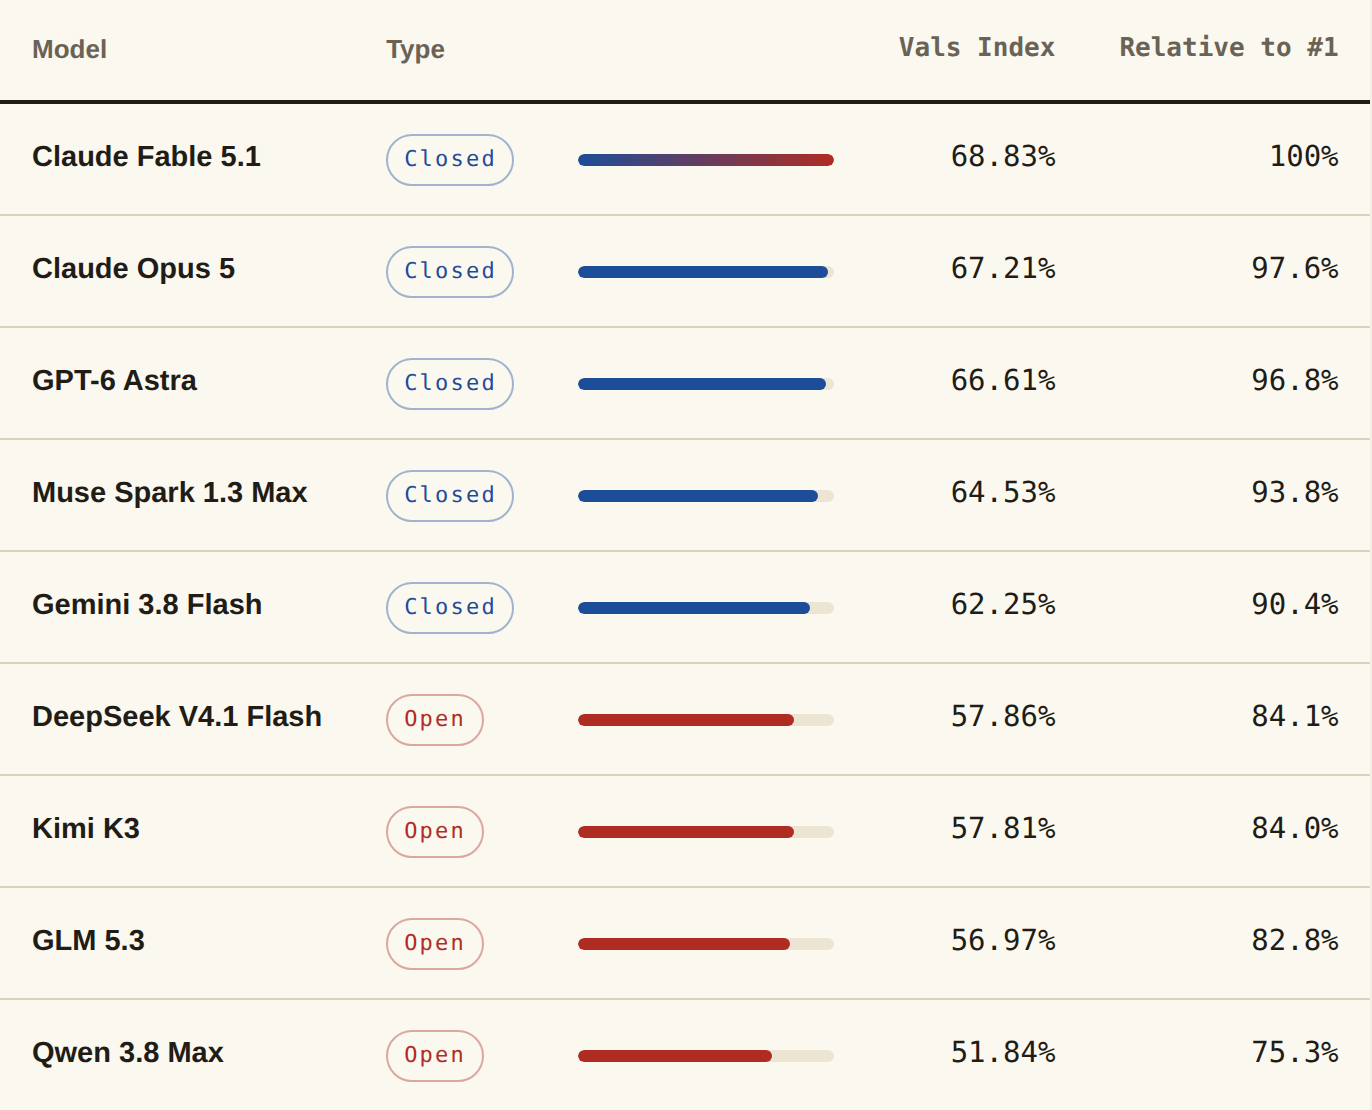
Table 2. Vals Index leaderboard (vals.ai homepage, updated 2026-09-15)
Note: Data is from the Vals Index homepage leaderboard (updated 2026-09-15). The full leaderboard covers 58 models; this table lists the top 5 plus the leading open models. "Relative to #1" uses Claude Fable 5.1's 68.83% as the baseline. The open models' positions come from the full leaderboard and aren't visible in the screenshot.
Next to the Arena numbers, the difference between the two yardsticks is plain. On user preference, the leading open models trail the top model by about 5% to 10%. On real task completion, DeepSeek V4.1 Flash (57.86%), Kimi K3 (57.81%) and GLM 5.3 (56.97%) reach about 84%, 84% and 83% of the top score, and Qwen 3.8 Max (51.84%) about 75%, so the gap grows to 16% to 25%. Closed models lead by more when the question is who finishes the work than when it's who users prefer. Finance, law and coding happen to be where closed models gain most from English-language data and long iteration. Even so, five open labs (DeepSeek, Kimi, GLM, Hy4 Preview and Qwen) place in the top 30 of the full leaderboard. Open models are usable on real tasks and are catching up. The gap is real, and how big it looks depends on the yardstick.
Taken together, the two leaderboards show closed models still ahead overall, with a clear edge in complex reasoning, agent workflows and English professional work. How far ahead depends on the measure: about 5% to 10% on Arena's user preference, about 16% to 25% on Vals Index task completion. The two readings are consistent. Users can barely feel the difference any more, while the gap in professional task completion is still visible. On either measure, open models are in the global top tier and long past the question of whether they're usable. Both camps are building models of the same generation, and what separates them is performance. That makes the gap only one factor in choosing a model, and cost comes into the decision.
3. Which one to choose
Once the user-preference gap is down to single-digit percentages, the useful measure becomes performance-to-cost ratio: how much effective performance a given budget buys. This is the logic open models compete on. When performance is close, price carries the most weight in large-scale use.
Performance and price don't move in proportion, which is why they're worth looking at together. Leading closed models are positioned on top performance, and their prices reflect R&D spending and scarcity. Leading open models give up some performance for very low marginal cost, and their pricing looks more like wholesale for large deployments. Each strategy serves a different customer. The first suits high-value decisions with little room for error, and the second suits high-volume production work. That's how an 8% performance gap and a 190x price gap can exist at the same time.
The price gap is far wider than the performance gap. Pricing published alongside the Image-to-WebDev leaderboard puts GPT-6 Astra at about $40 per million tokens, Muse Spark at about $3.50 and GLM-5.3 Flash at about $0.21. GPT has roughly an 8% performance edge over GLM and costs about 190 times as much. For a company using 100M tokens a day, that works out to about $4,000 a day on GPT versus about $21 on GLM. At that scale the savings far outweigh the lost performance, and that's the direct reason more companies are moving to open models. The Vals Index site gives a second view of price. Hover over a score bar and it shows what each model costs, in dollars, to complete one real task. The gap between the two camps is just as wide there.
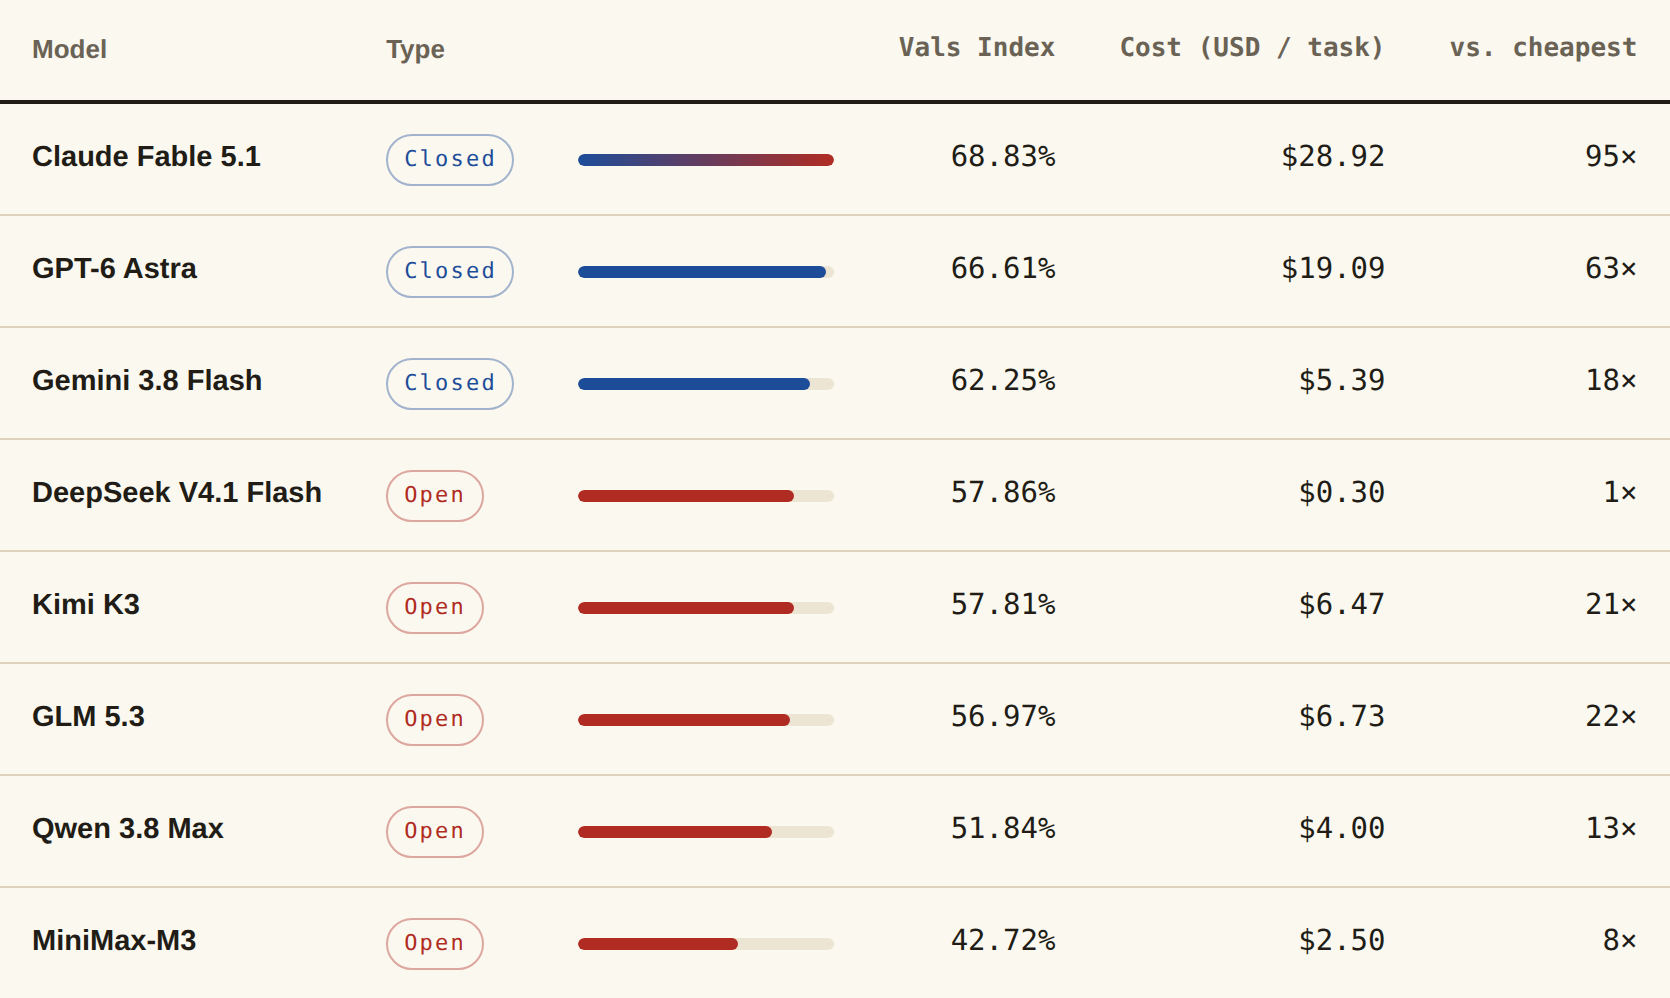
Table 3. Performance vs. evaluation cost (Vals Index, 2026-09-15)
Note: Evaluation costs come from the Vals Index homepage leaderboard (hover over a score bar to see them) and show the dollar cost of completing one real task, updated 2026-09-15. "vs. cheapest" uses DeepSeek V4.1 Flash ($0.30), the cheapest model, as the baseline.
That leaves two paths.
| Option 1: highest quality | Option 2: best cost efficiency | |
|---|---|---|
| Use cases | Academic research, legal analysis, English-language papers, investment research, high-stakes decisions | Chinese-language writing, customer service, market research, data processing, knowledge bases |
| Recommended models | GPT, Claude (closed) | Qwen, Kimi, GLM, DeepSeek (open) |
| Why | Still ahead on complex reasoning and agent execution, and more dependable in international professional settings | Close to the top closed models in performance at a much lower cost, which suits high-volume use |
Conclusion
Closed models set the performance frontier, and open models set the cost-efficiency frontier. Competition in the global AI market is shifting from raw capability toward performance-to-cost ratio. For most companies, the question now is whether the last 5% to 10% of performance is worth paying tens or even hundreds of times more.
It depends on the use case. High-value decisions justify paying for performance, and applications running at scale don't. The market will most likely settle into two tracks split by use case, with closed models keeping pricing power in high-value work and open models taking high-volume work on marginal cost. Performance-to-cost ratio will keep deciding where the line between them falls.
References (APA 7th)
- Arena AI. (2026). Code Arena: Image-to-WebDev leaderboard. Retrieved September 18, 2026, from https://arena.ai/leaderboard/code/image-to-webdev
- Vals AI. (2026). Vals Index and benchmark methodology. Retrieved September 18, 2026, from https://www.vals.ai/home